Vibecoding a Monthly Report View
Last time I showed how Gemini is able to extract structured data from Brazilian monthly FII reports.
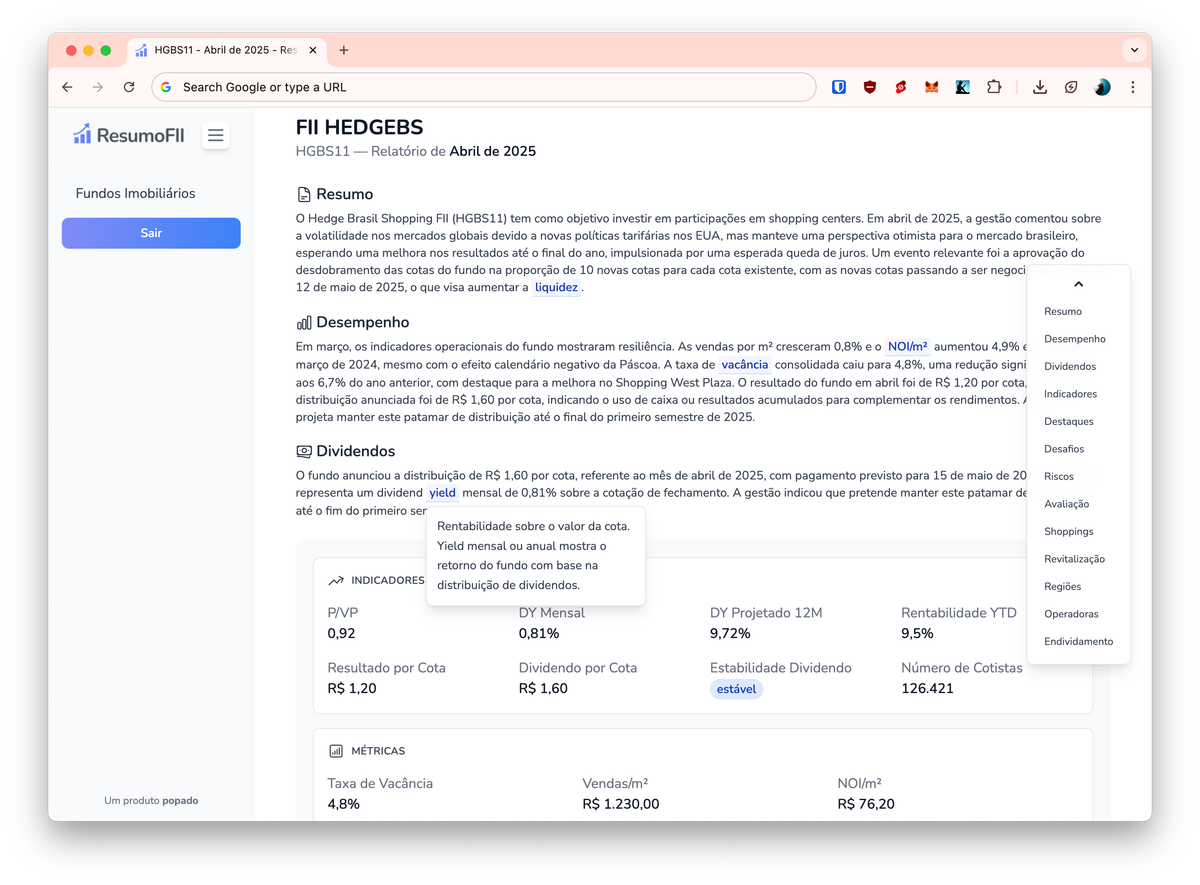
I've been iterating/vibe coding ways to display the dynamic report data within the Svelte frontend and hit on something that's interesting enough for the MVP version of the app.
Recall that what I'm trying to solve for is rapid understanding of fund fundamentals over time. So the idea is to have the AI pipeline read all fund reports automatically each month and keep track of changing fundamentals. I'm not focused on scraping tickers or tracking daily price moves. The goal is to surface insights that help guide long-term decisions. I want to understand the risks, changing strategies and investment thesis well enough to make a judgement call on whether or not a FII aligns with my investment goals.
The overall system should help demystify all the nomenclature and reduce noise. Reading a report should help guide my understanding of what's happening with the fund and if it makes sense to change my position when the fund no longer delivers what was initially posited.
Surfacing Highlights, Challenges and Risks
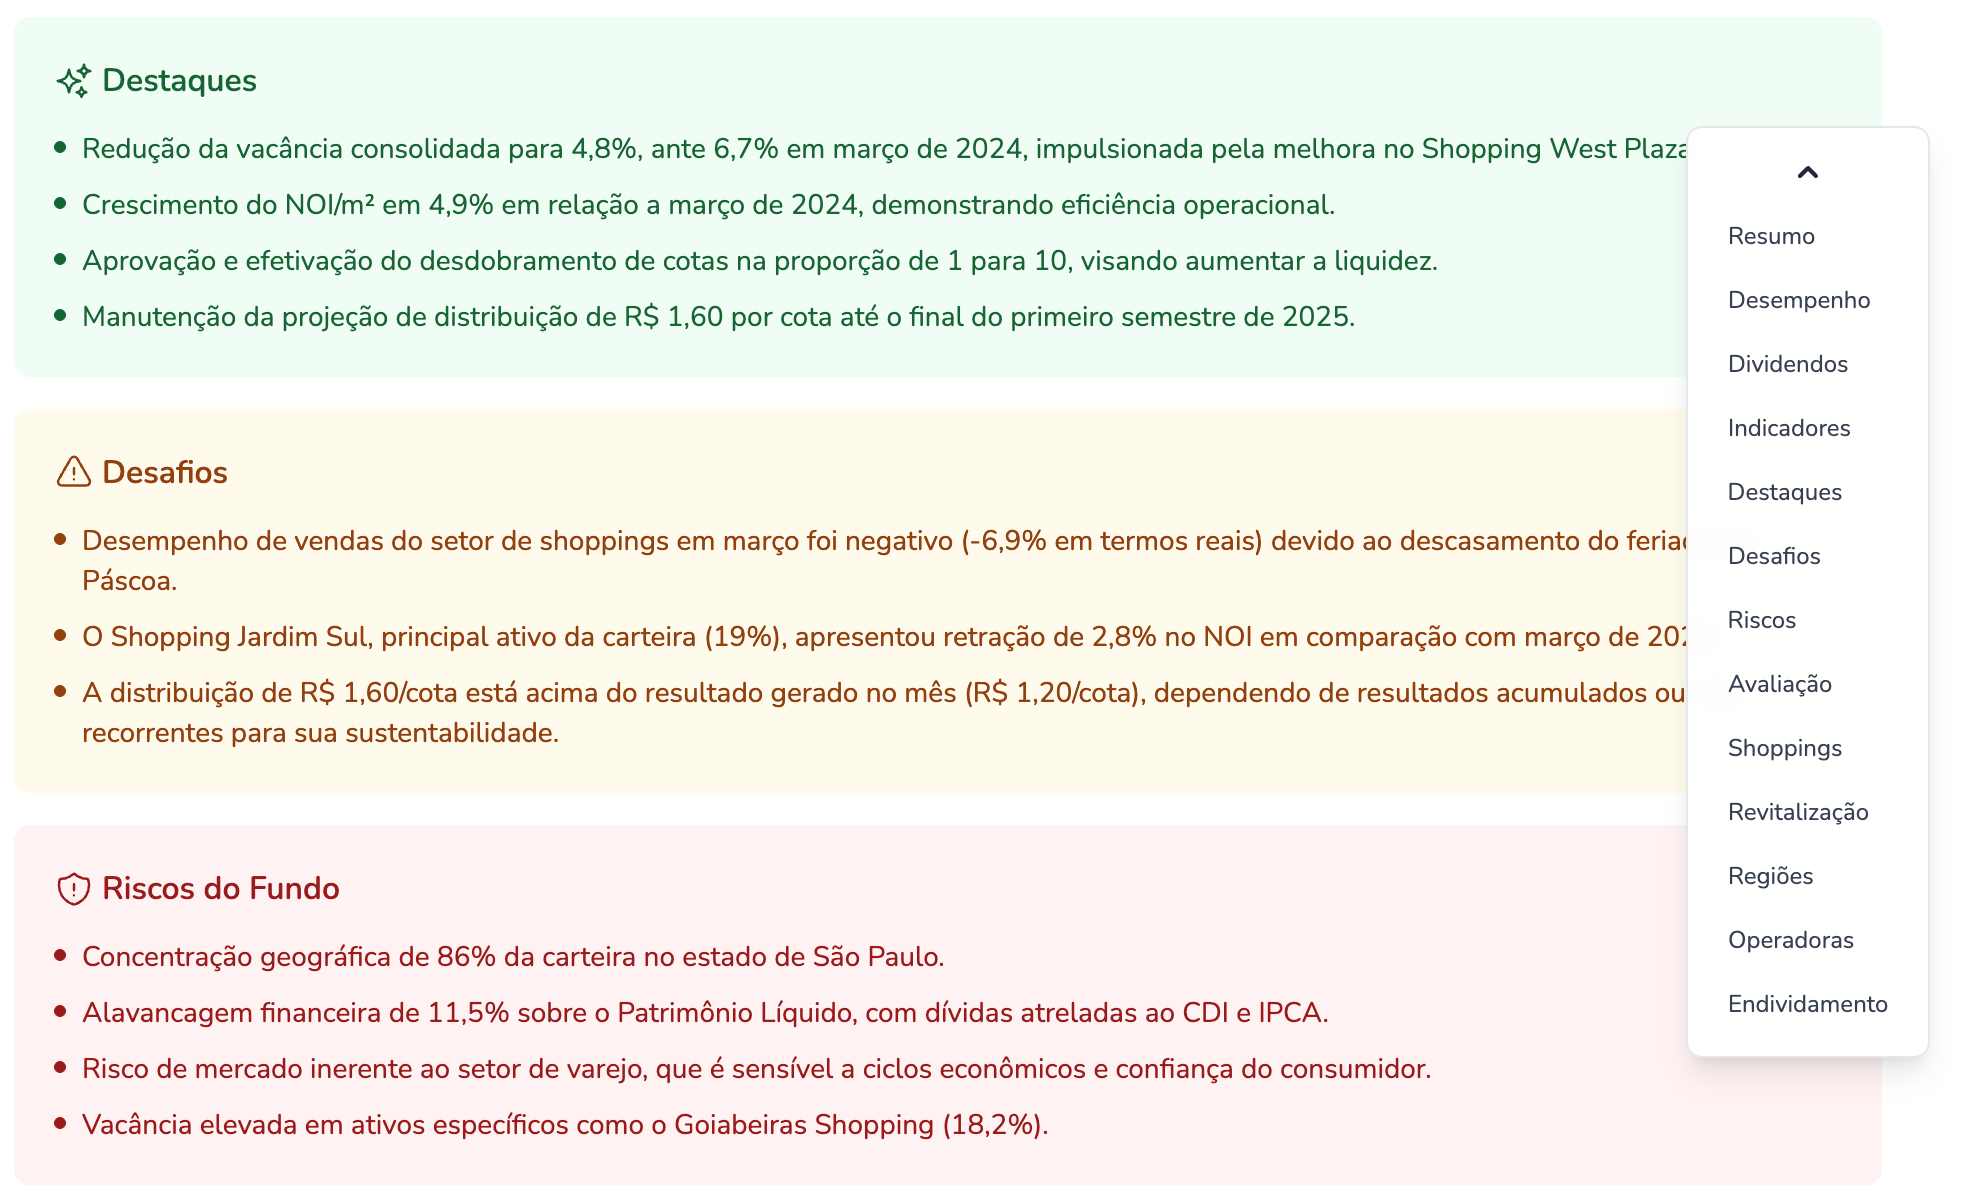
One of the main sections of the report view is this trifecta of highlights, challenges and risks.
The highlights are positive signals extracted from the PDF. So we see things like increasing net operating income/m², reducing vacancy rates or stable dividend distributions.
The challenges reflect negative signals mentioned by the fund manager. This could include a drop in sales at a specific shopping mall property or concerns about whether the fund's distributions are fully covered by its net income.
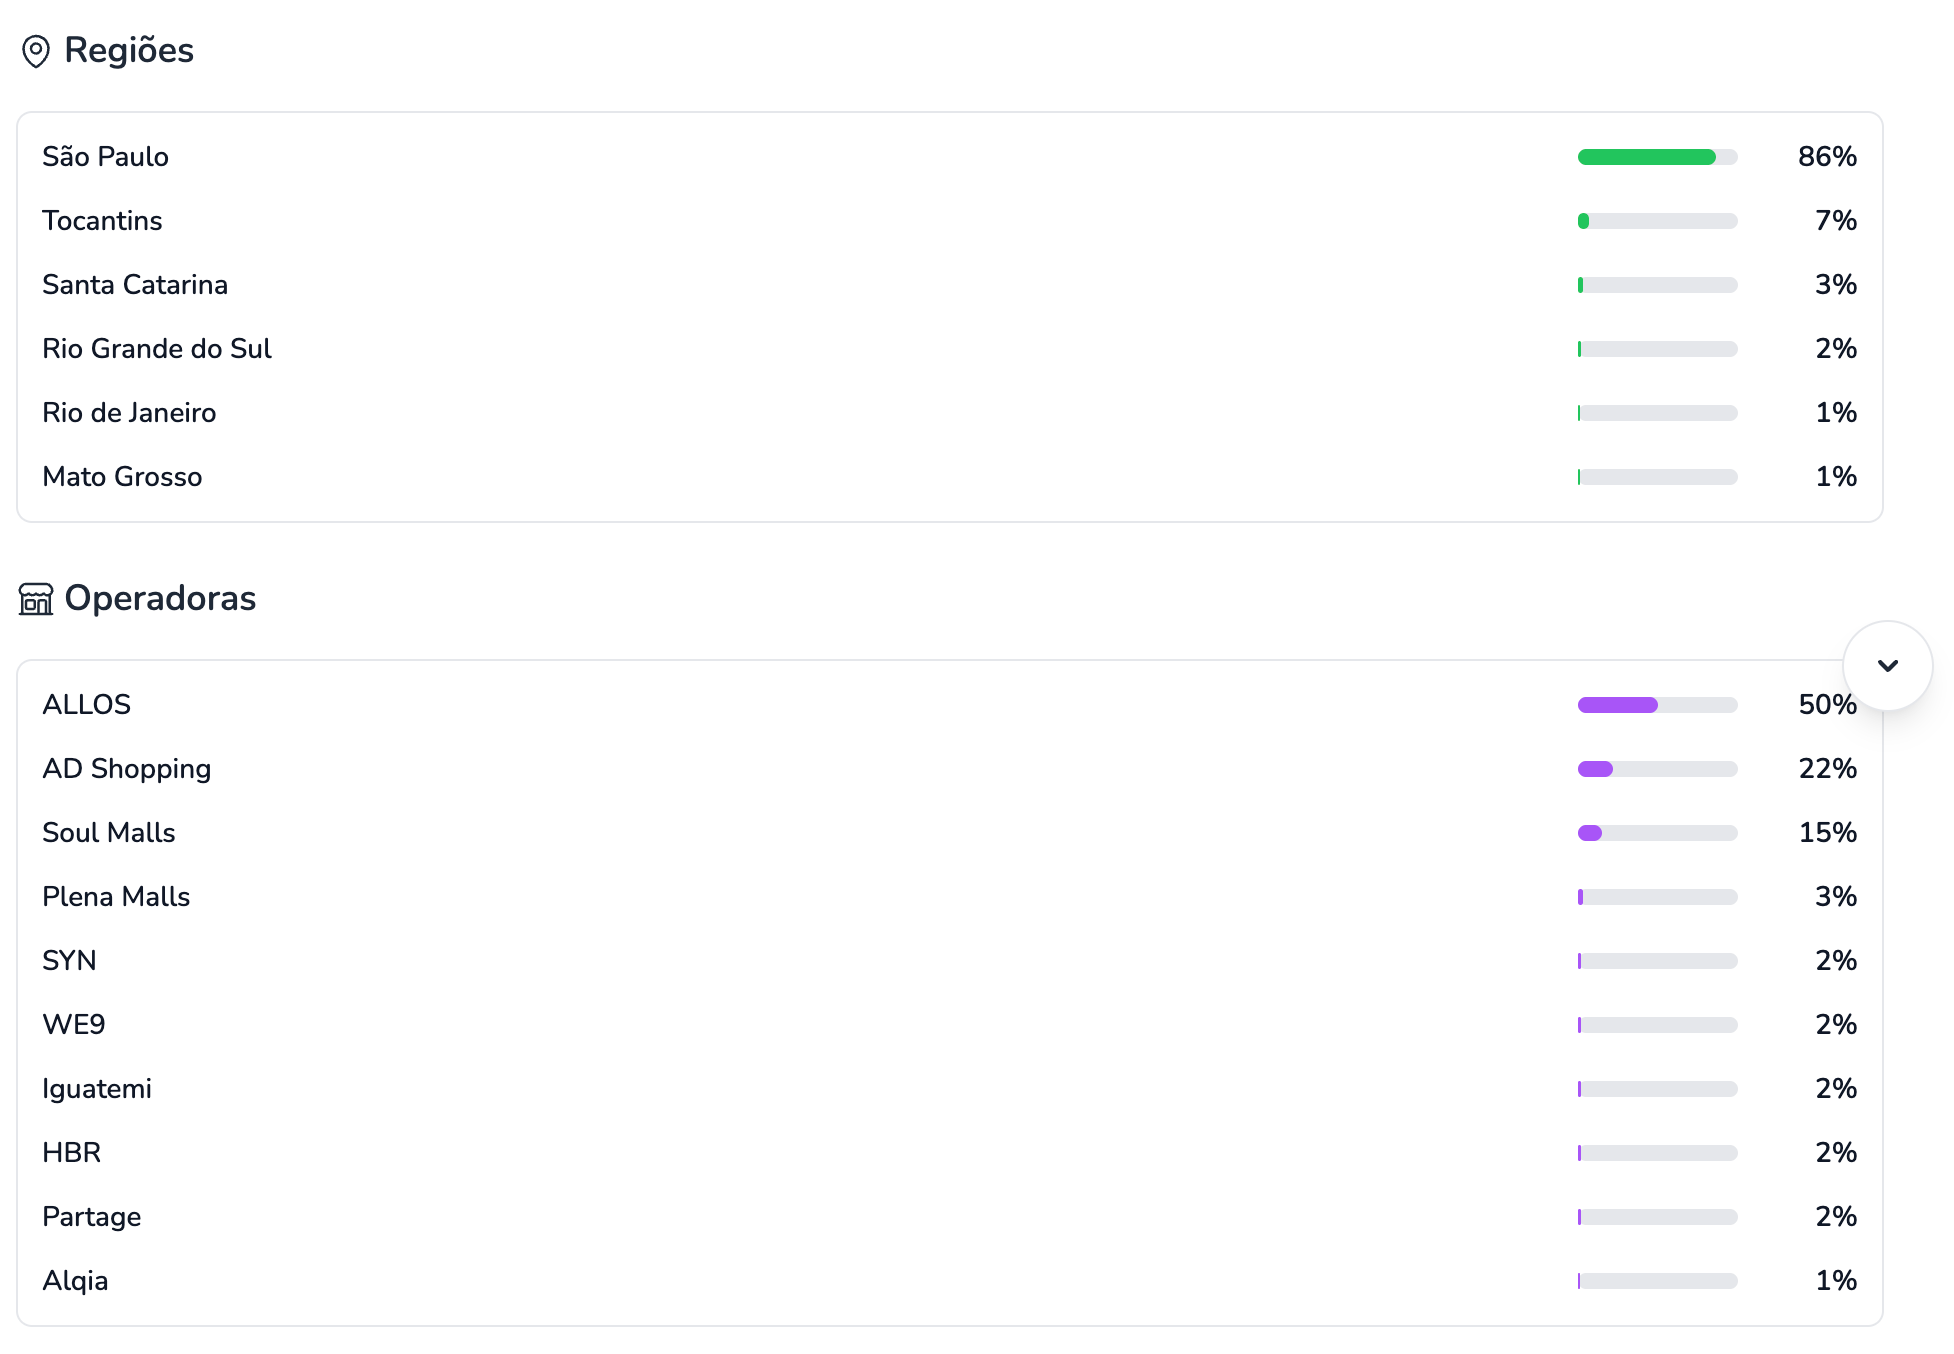
The risks are possible problematic signals inherent to the fund and not specifically related to what has happened in any specific month. In the above example we see that for this Shopping Mall fund there is a 86% portfolio concentration within the state of São Paulo.
This helps guide my thinking as to whether the risks are acceptable to me or not.
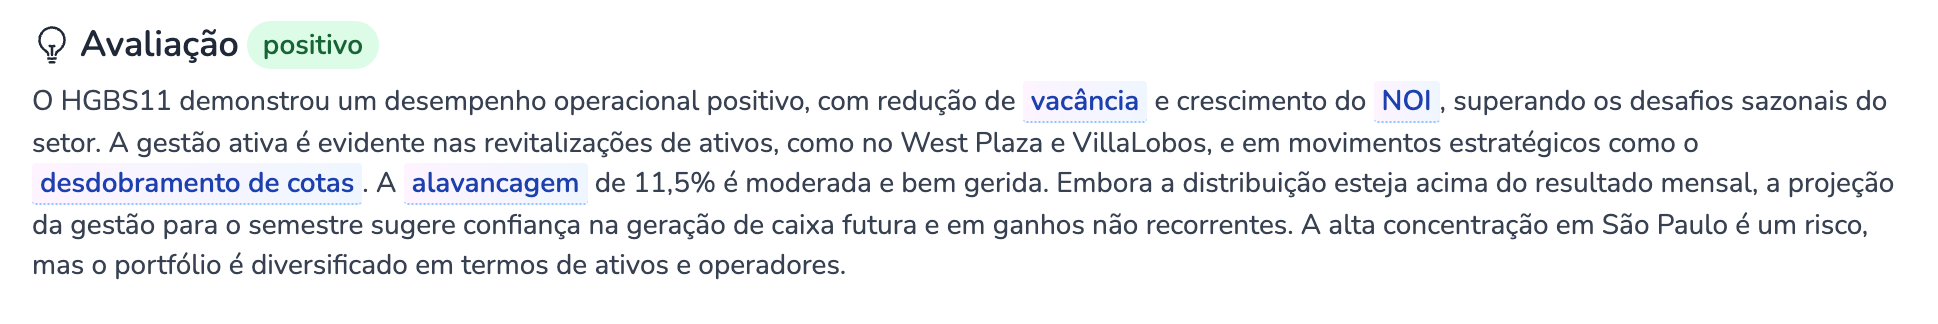
Report Evaluation
We also get a small section that's a basic sentiment analysis. In this case the evaluation is positive due to a reduction in vacancy rates, increase in net operating income, improving liquidity and moderate leverage.
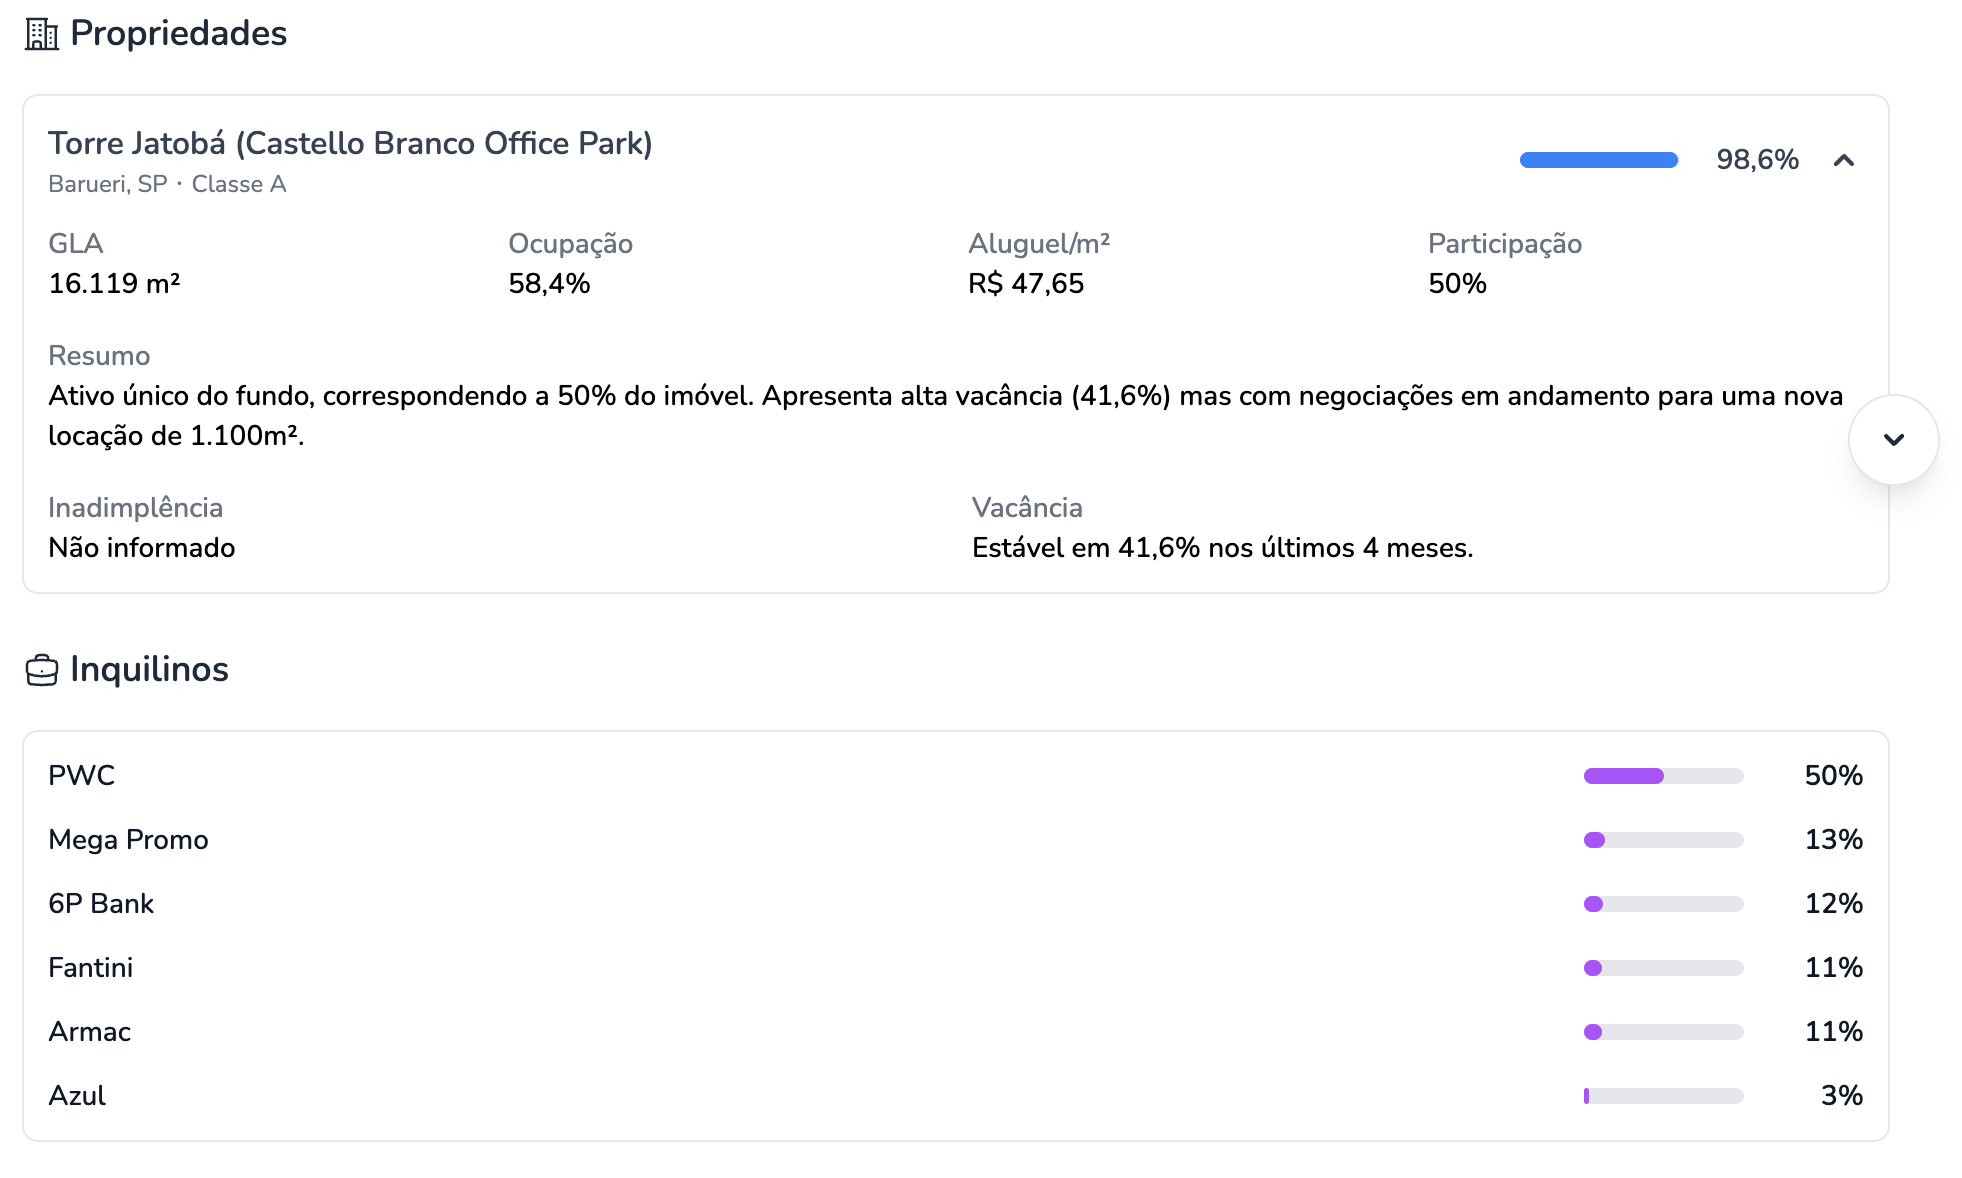
Compare this to CBOP11, a fund owning a single commercial property.
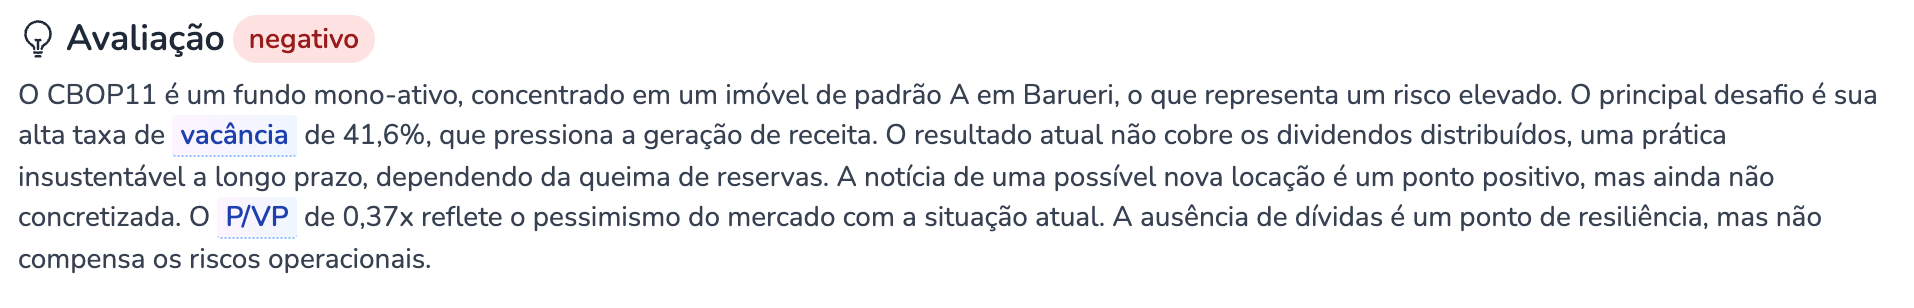
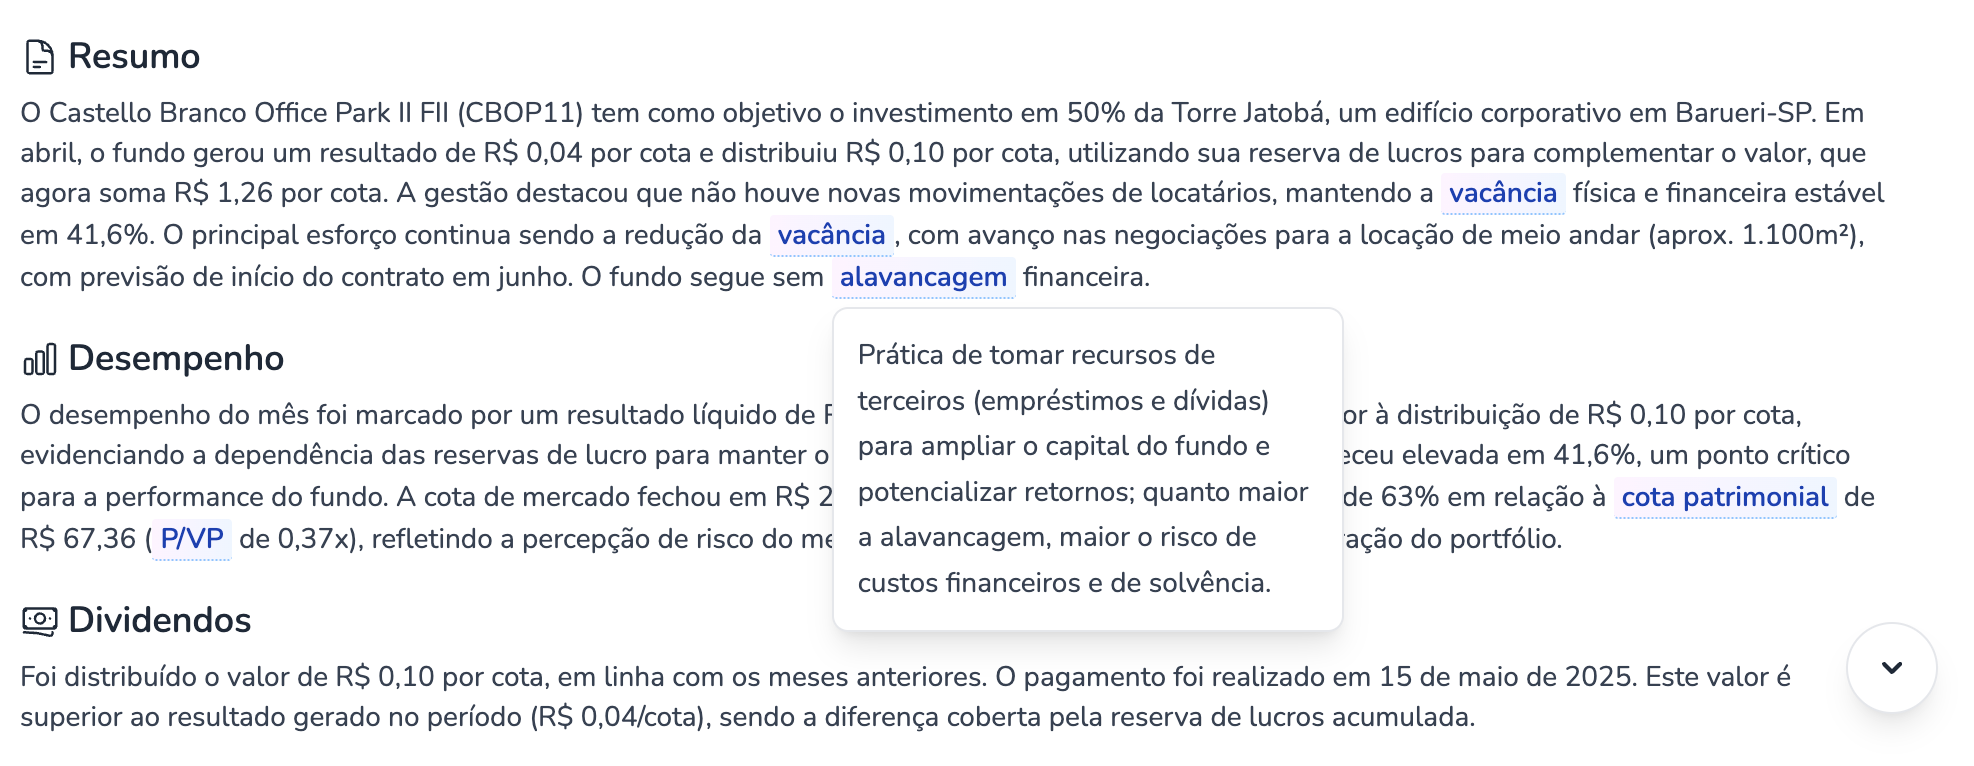
The vacancy rate is high at 41,6%, price to book ratio is 0,37 which reflects a negative sentiment across the market. This single property is located in an area where there have been persistent challenges with low vacancy rates. Not a good signal and not something I'd like to allocate part of my money to. Buyer beware.
Dynamic Report Schemas
Given that there are different types of real estate funds ranging from those investing in commercial paper, office buildings, shopping malls, real estate development etc. I am directing Gemini to generate dynamic JSON so the UI needs to be prepared to display a shopping list for a Shopping Mall fund or a list of commercial properties for office type funds.
Again if we compare CBOP11 to HGBS11 we see distinct UI elements in the report view.
A final touch I added is a built-in glossary that highlights terms that retail investors may not be familiar with. The idea is for the app to be a helpful guide in building understanding, something like an automated investment analyst that builds a document structure with a sensible order to help you make better decisions.
This is enough tinkering without validation for now.
Next up:
- Build the monthly batch job
- Admin UI to show/hide funds
- Admin UI to lock/unlock a fund
- Admin UI to manually generate a report for a given month and year
- Stripe integration
And soft-launch it via an appropriate distribution channel to start gathering feedback.
Thanks for reading.